 |
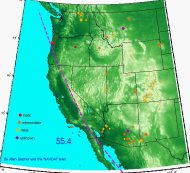
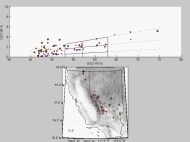
Plot of onset of magmatism in the western United States, defined by 90th percentile of ages within 1x1 degree blocks. Note the southwestward sweep out of Montana toward California, and the northward sweep out of Mexico. Evidence for an east-to-west sweep is not clear.
Click Here for full sized image.
|
 |
QuickTime Animation of magmatism in the western United States over the past 65 million years. Dots are color-coded by
general compositional category. Points start to appear 1 million years before the age listed in the database, grow to maximum
size at the listed age, and then shrink to zero radius for the next 2 million years. Plate boundaries are taken from Tanya
Atwater's reconstructions; red lines are oceanic plate boundaries, the dashed magenta line is the Pacific-Farallon trench,
and the solid magenta line is the developing San Andreas transform. Note that the plate elements are palinspastically restores
whereas the North American base map and igneous points are not; the subduction zone and transform swing northwest as the
Basin and Range opens.
Several magmatic patterns are apparent in this animation, including migration of silicic volcanism from Montana to Nevada,
a clockwise sweep of magmatism around the southern edge of the Colorado Plateau, a burst of magmatism in northern Nevada around
17 million years ago (the Yellowstone event), and the general "basaltification" of magmatism throughout the Cenozoic.
(If your browser does not open the movie in a separate window
when you click on it, save it as a file and open it with a media player)
|
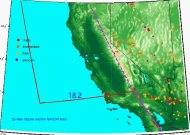 |
QuickTime Close-up of California and Nevada. The 3.5 million year event in the Sierra Nevada is clearly shown. Several enigmatic migrations (e.g., northward in the San Francisco Bay area, westward into the Cascades, and westward from Nevada into the Sierra Nevada are apparent.
(If your browser does not open the movie in a separate window
when you click on it, save it as a file and open it with a media player)
|
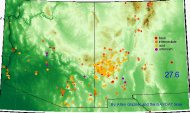 |
QuickTime Close-up of Arizona and New Mexico. Note migration of basaltic volcanism from central Arizona north to the Grand Canyon, and the complexity of magmatism in New Mexico.
(If your browser does not open the movie in a separate window
when you click on it, save it as a file and open it with a media player)
|
 |
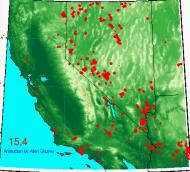
QuickTime Animation including DDS-14, AZ, NM, and new NAVDAT data.
(If your browser does not open the movie in a separate window
when you click on it, save it as a file and open it with a media player) |
 |
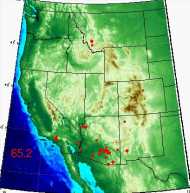
QuickTime Closeup of CA and NV from 40-present including NAVDAT data, DDS-14, and Nevada data.
(If your browser does not open the movie in a separate window
when you click on it, save it as a file and open it with a media player) |
 |
K2O vs. SiO2 animated by time for California and Nevada.
The color of the plotted point corresponds to geographic position, allowing comparison of the map to the variation diagram. Note the extremely potassic nature of the 3.5 Ma event in the central Sierra Nevada. Animation by Austin Roelofs and Russell Mapes.
(If your browser does not open the movie in a separate window
when you click on it, save it as a file and open it with a media player)
|
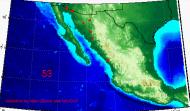 |
Animation of existing data from Mexico as of Feb 04.
The southward sweep of magmatism into the active Trans-Mexican Volcanic Belt is well displayed.
(If your browser does not open the movie in a separate window
when you click on it, save it as a file and open it with a media player)
|
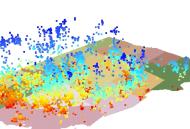 |
Hypersonic flight through the age field (6.5 Mb QuickTime movie)
Ages are coded by color and height, ranging from dark blue (early Tertiary) to red (Quaternary). Same data as above.
(If your browser does not open the movie in a separate window
when you click on it, save it as a file and open it with a media player) |
 |
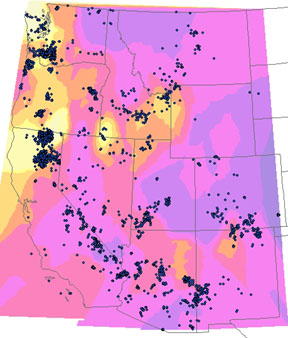
This image shows the distribution of K2O in mafic rocks (SiO2 < 55 wt%). Yellow is low, blue is high. Several trends are apparent:
K2O generally increases inland
K2O is lowest in the Pacific Northwest
A band of low K2O follows the Snake River Plain track (tholeiites)
High K2O samples occur anomalously far westward in southern Nevada and the Death Valley region |
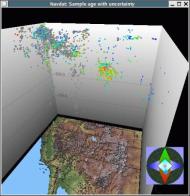 |
Time-Space Volume Visualization of the Navdat Database
created by Rick Brownrigg |